Netflix Data Analysis Dashboard
Project Overview
This project uses the Netflix Movies and TV Shows dataset from Kaggle, containing details about content such as title, genre, type, cast, country, release year, and more. The dataset size is approximately 1.2 MB and includes over 8,800 records.
I worked on this project using Power BI, where I applied data cleaning and transformation through Power Query. I also created calculated columns and measures using DAX to develop insightful KPIs and visuals.
Steps Performed
- Removed missing and duplicate records
- Transformed date and string formats
- Created new fields to classify content (e.g., Movie vs Show)
- Filtered and grouped data by region, release year, and category
Tools Used
- Power BI (Data modeling, DAX, dashboard creation)
- Power Query (Data cleaning and transformation)
- Kaggle Dataset: Netflix Movies and TV Shows
Key KPIs Displayed
Total Titles by Type (Movies vs TV Shows)
Content Distribution by Country
Top Genres and their Frequency
Trend of Releases Over the Years
Ratings & Duration Analysis
Dashboard Snapshots
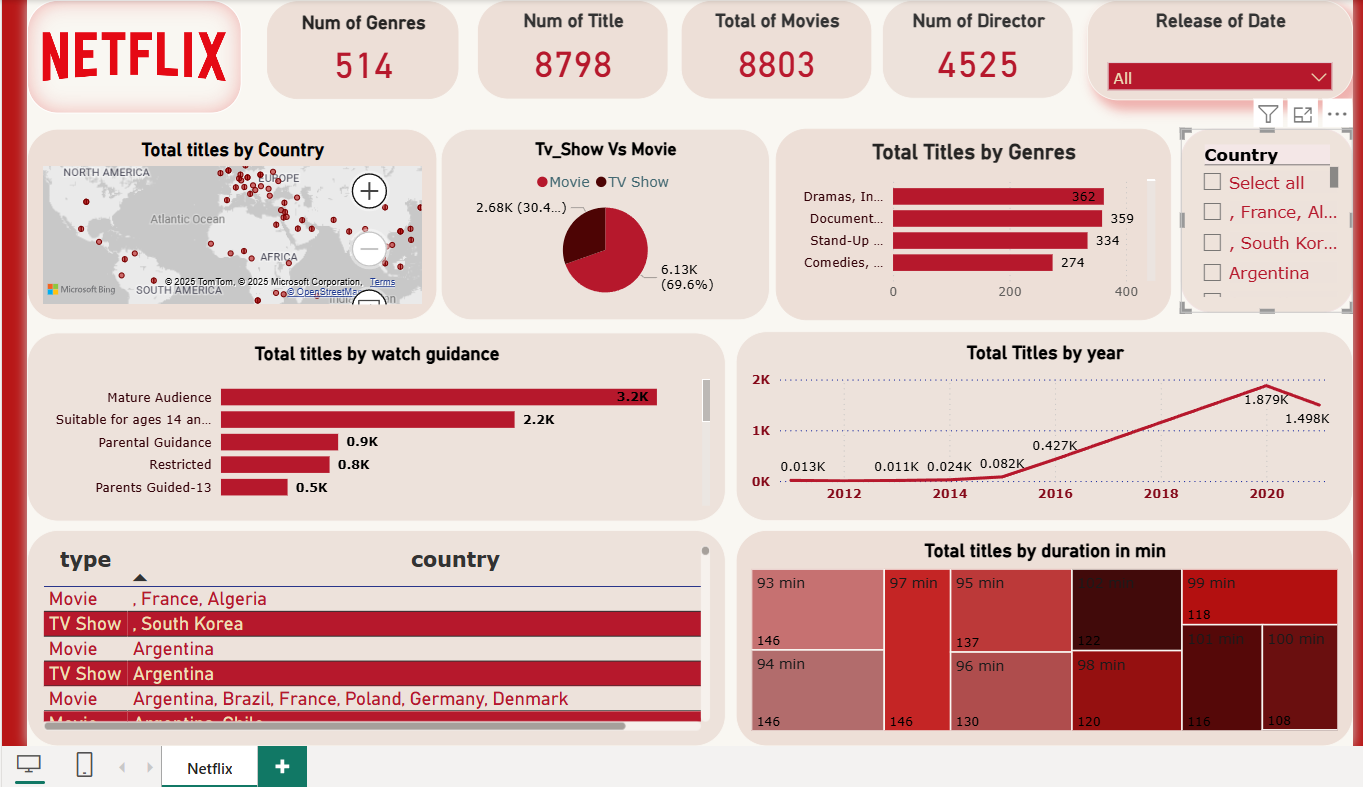
Note: This dashboard highlights Netflix content trends across countries and over the years.
All visualizations are fully interactive and optimized for performance and storytelling.