Adventure Works 2022 Sales Dashboard
Project Overview
This project focuses on analyzing sales and product performance from the Adventure Works 2022 dataset by Microsoft. The dataset simulates a retail business and contains information on customers, orders, products, and sales across different regions.
The Power BI file size is approximately 80MB, and it required a deep cleaning process due to multiple relational tables and inconsistent formats.
Data Cleaning Process
- Merged related tables using primary and foreign keys (e.g. Sales ↔ Products ↔ Customers)
- Filtered out irrelevant columns to improve performance
- Resolved missing product or customer fields
- Normalized date formats and calculated new time-based fields
Tools Used
- Power BI (Relationships, DAX, visuals)
- Power Query (Data transformation & cleaning)
- Adventure Works 2022 Dataset by Microsoft
Key KPIs Displayed
Total Sales by Product Category
Top Performing Products
Revenue by Region
Monthly Sales Trend
Customer Segmentation by Purchase Behavior
Dashboard Snapshots
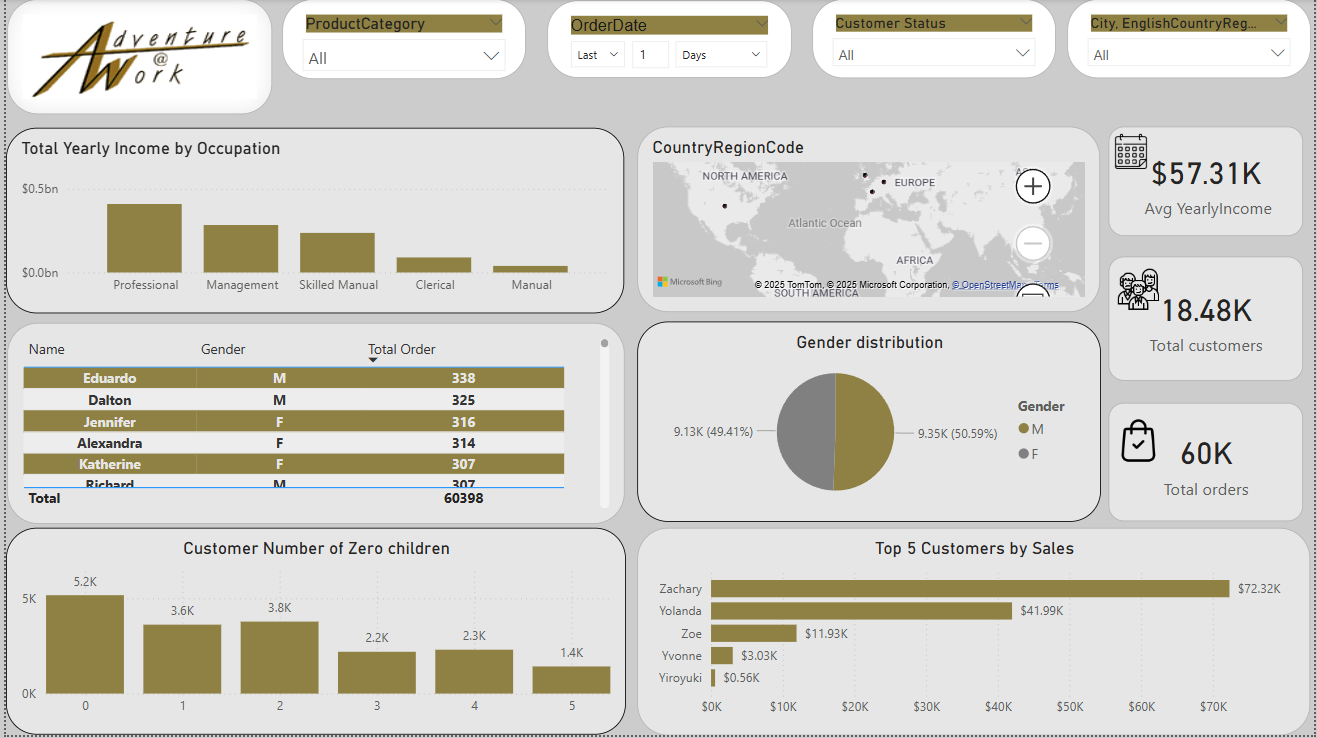
Note: This dashboard helped visualize complex relationships and extract business insights
through KPIs and filters. Focus was on identifying best-selling products and regional trends to guide
decision making.